It’s been a while.
With the cascading rush of the Trump years toward an alleged full employment in the wake of the 2016 election seeming to reflect a widespread acknowledgment that officially reported unemployment was failing to capture the full picture, I’ve taken some time off from my meticulous charts documenting the ongoing gap between what I call “real unemployment” and the reported figure. Maybe I just got busy with other writing.
The TL;DR of the pre-coronavirus era is that yes, things got a bit better, but no, we were nowhere near “full employment.” Things were improving just before COVID-19 struck America, as is understood, but the February 2020 low was actually 8.69% unemployment, with the invisible gap of over 5% stemming from a still quite low labor force participation rate of 63.4%. That 63.4% was admittedly tied for a seven-year high, dating back to February 2013, but is still well short of anything reflecting full employment. With the onset of coronavirus, lightly felt in March and fully impacting April and May, labor force participation has again dropped off the table, alongside a surge in acknowledged unemployment that set a record as far back as BLS’ online data (since January 1948) will take us.
Participation rates are again scraping the bottom of the 60% line, nadiring at 60.2% in April 2020 and threatening to cross into the 50s. The last time the participation rate was below 60% was in 1971, an era when women still had yet to be widely integrated into the labor force (in 1971, just 43.4% of women were in the labor force; this peaked at 60% in 1999). This combines especially poorly with a spike in reported unemployment, such that the actual unemployment in April was a whopping 23.36%, and not much better last month at 21.32%.
Here are your charts:
Real Unemployment (red) vs. Reported Unemployment (blue), since January 2009:
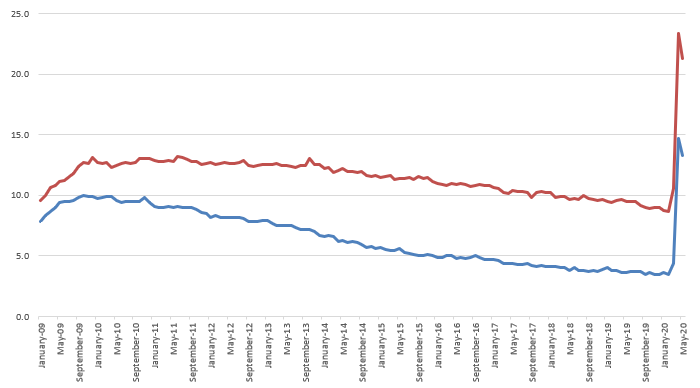
Source: BLS data, as analyzed by Storey Clayton
Reporting Gap between Real and Reported Unemployment, since January 2009:
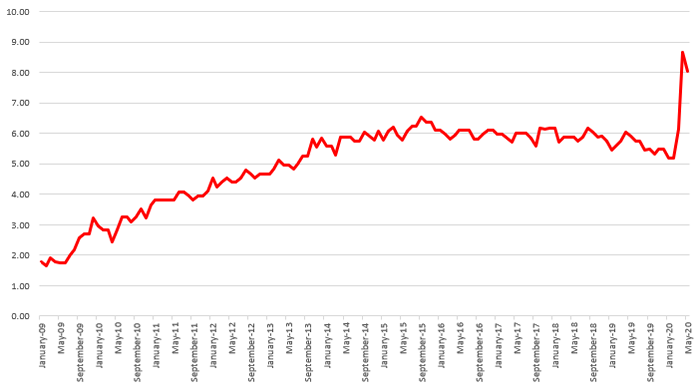
Source: BLS data, as analyzed by Storey Clayton
Obviously we know that the economic instability manifest by the coronavirus is off the charts and feels unprecedented. A recent argument I’ve had to field on Facebook posts claims that the stock market has recently skyrocketed because 33% unemployment was “priced in” and everyone’s euphoric that it’s only at a 75-year high. So it may seem gratuitous to pile onto this situation by observing that unemployment is nearly ten points higher than is being reported. But given that ten points, by itself, is the peak of the officially reported figure in the so-called Great Recession, it seems like that percentage of folks being invisibly unemployed is, uh, kind of a big deal. As is the importance of this gap when those folks are being left out of the expanded benefits packages temporarily being offered.
Stay tuned.
This is part of a continuing series on the under-reporting of unemployment in the United States of America.
Past posts (months indicate the month being analyzed – the post is in the month following):
November 2016
May 2016
September 2015
July 2015
June 2015
March 2015
February 2015
December 2014 – labor force participation assessment
December 2014
November 2014
October 2014 – age assessment
October 2014
September 2014
August 2014
April 2014
December 2013 – seasonal assessment
December 2013
March 2013*
August 2012*
July 2012* – age assessment
July 2012*
*My initial analyses led to a slight over-reporting of the impact of the reporting gap, so the assessments in these posts are inflated, as explained and corrected in the December 2013 analysis.


